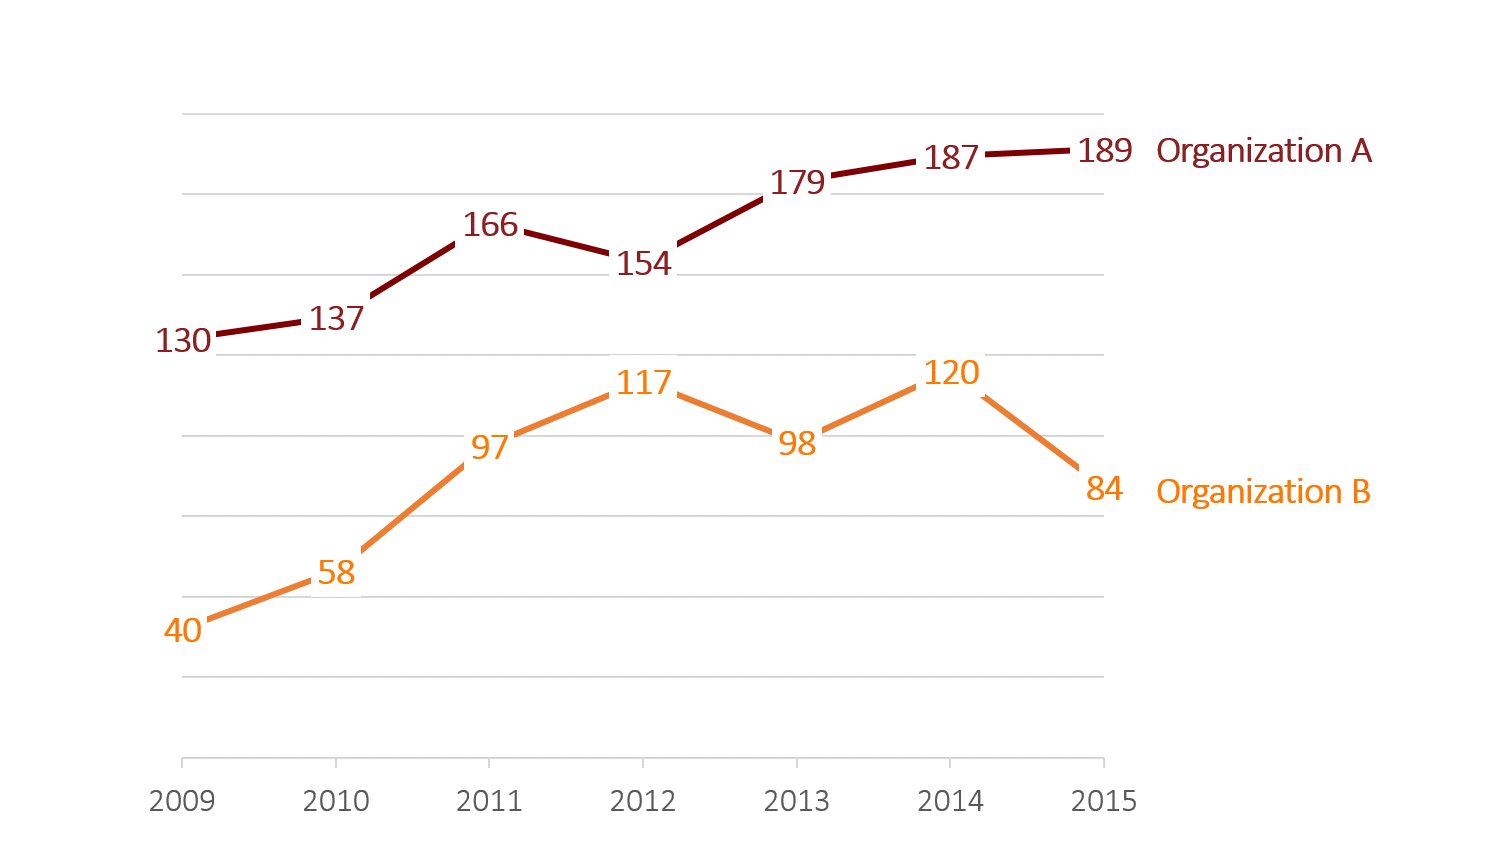
Data visualization is more about strategic thinking than about following steadfast rules. Take a simple line graph, for example. How will you label your line graph? With vertical axis labels and light gray grid lines? With labels directly above or on top of the data…


