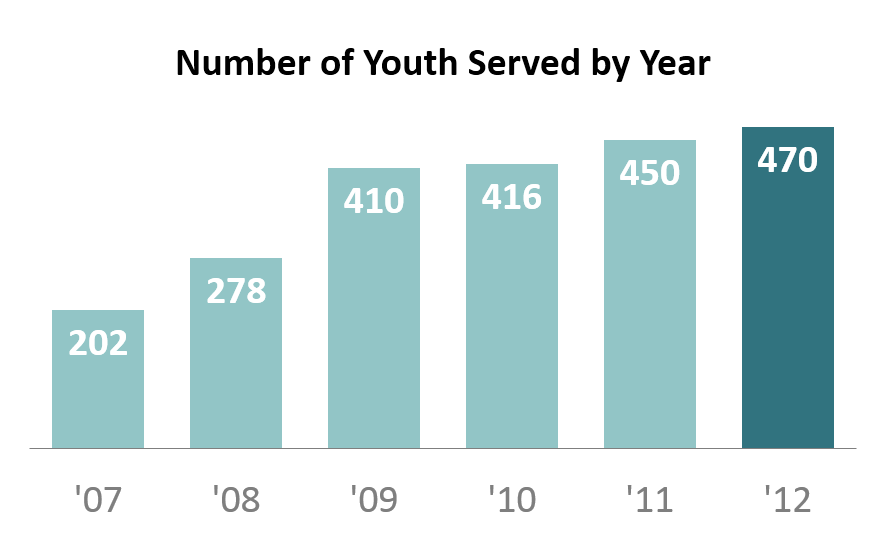
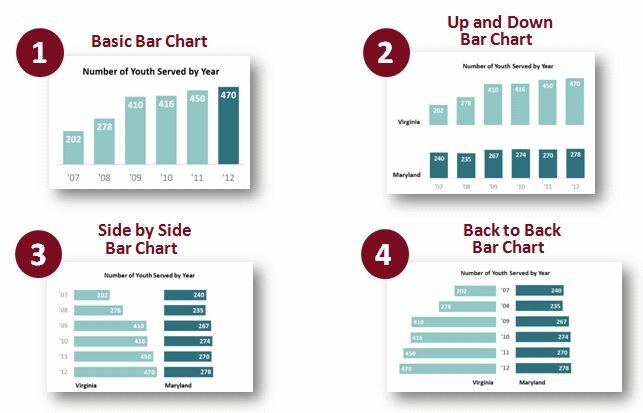
Two weeks ago, I challenged readers to re-create the “after” version of a basic bar chart. You can read the full post here. Congratulations to the 9 winners: Molly Hamm, David Napoli, Susan Kistler, Jon Schwabish, Ethan, Mike, Sara Vaca, Samantha Grant, and Kevin Gilds! You’ve…
- About
- Blog
-
Upcoming Events
- 7/25: Workshop for NeighborWorks America
- 9/10: California Wellness Foundation’s 2014 Organizational Learning and Evaluation Conference
- 10/23: Workshop for 21st Century Community Learning Centers
- 10/24: Workshop for the Indiana Evaluation Association
- 11/19: Webinar for the National Network of Consultants to Grantmakers
-
Past Speaking & Writing
- #JAGUnity2014: Data Visualization for Philanthropists
- The Data Visualization and Reporting Topical Interest Group
- Transforming Your Affiliate into a Well-Oiled Machine
- Bringing Statistics to Life
- #YNPNdc14: DataViz! Tips, Tools, and How-Tos for Visualizing Your Data
- How to Use Data Visualization to Better Tell Your Story
- Excel
- Resources


