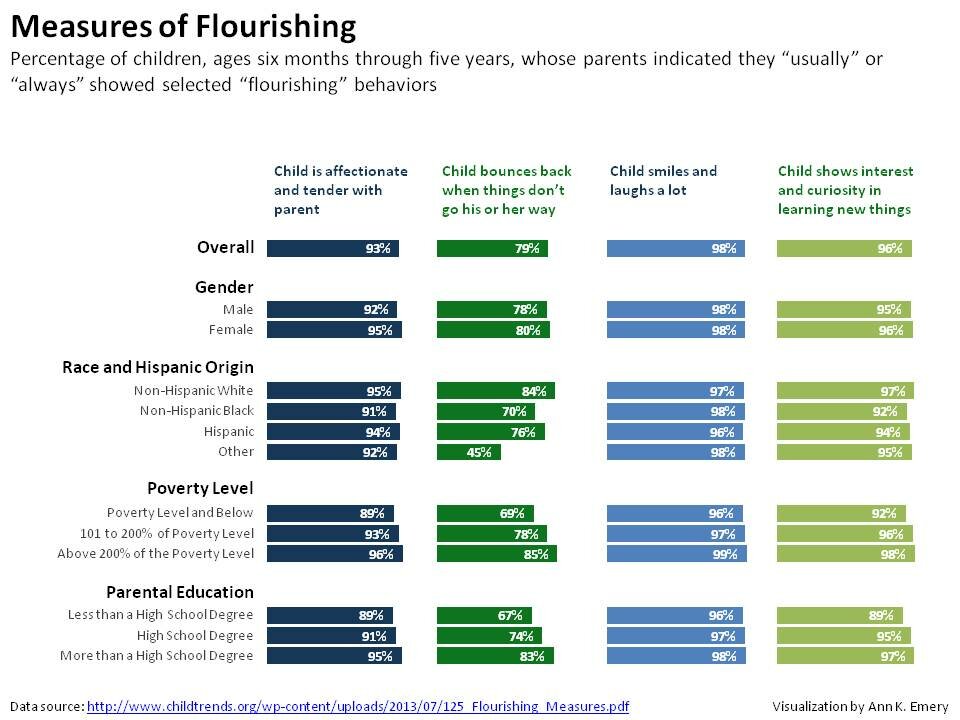
When social scientists like me have lots of data, we tend to put it in tables. There’s nothing wrong with tables. They contain infinite details within a finite and teeny space, and they give the reader freedom to draw his or her own conclusions about which details…
- About
-
Blog
- From Data Table to Small Multiples in Under 5 Minutes
- Storyboarding Your Data Visualizations in Videos, Webinars, Presentations and More
- vlookup: One Excel Function to Rule Them All
- Who Knew Dataviz Could Be So Easy? (Guest Post by Stephen Alexander)
- Please: Don’t Use Default Color Schemes in Your Chart
- Avoiding Diagonal Text in Your Charts
- Upcoming Events
-
Past Speaking & Writing
- #JAGUnity2014: Data Visualization for Philanthropists
- The Data Visualization and Reporting Topical Interest Group
- Transforming Your Affiliate into a Well-Oiled Machine
- Bringing Statistics to Life
- #YNPNdc14: DataViz! Tips, Tools, and How-Tos for Visualizing Your Data
- How to Use Data Visualization to Better Tell Your Story
- Excel
- Resources