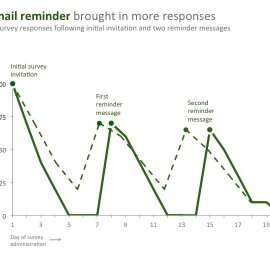
Let’s pretend you’re tracking whether friendly reminder messages bring in more responses to your survey. Can you spot the fatal flaw? See it? Go check out the x-axis. Where the heck are Days 5, 6, 7, 12, 13, 14, and 20? (This is where you…
- About Ann
- Services
- Blog
-
Events
- 10/17 Eval14 Conference: The Data Visualization Checklist
- 10/17 Eval14 Conference: Visual Approaches to Evaluation Reporting
- 10/21 Private Workshop: Latin American Youth Center Career Academy
- 10/23 Private Workshop: 21st Century Community Learning Centers
- 10/24 Public Workshop Hosted by the Indiana Evaluation Association
- 11/4 – 11/7: Evaluation Capacity Development in Uganda
-
Project Portfolio
- Visualizing Evaluation Results: Highlights from a Brown Bag for the Washington Evaluators
- 5 Things All Nonprofit Leaders Should Know About Logic Models
- #JAGUnity2014: Data Visualization for Philanthropists
- The Data Visualization and Reporting Topical Interest Group
- How to Use Data Visualization to Better Tell Your Story
- Excel
- Resources
- Contact
Comments